Welcome to Chris Crucial. Check out my mission statement on why you should invest in me. I’m now just 53(!) paid subscribers away from 3,500!! Help me make that goal! It’s $6 a month/$60 for the year. Do it today!👇
It’s getaway day for the long Labor Day weekend. Given that, I thought I would do something a little different tonight. Rather than give you three big stories from the day, I am going to give you 7 charts/maps/graphics that I think, when taken together, do a pretty good job of explaining where we are and where we are going in the 2024 race.
I hope you enjoy them. Be safe and have fun this weekend. See you after Labor Day!
— Chris
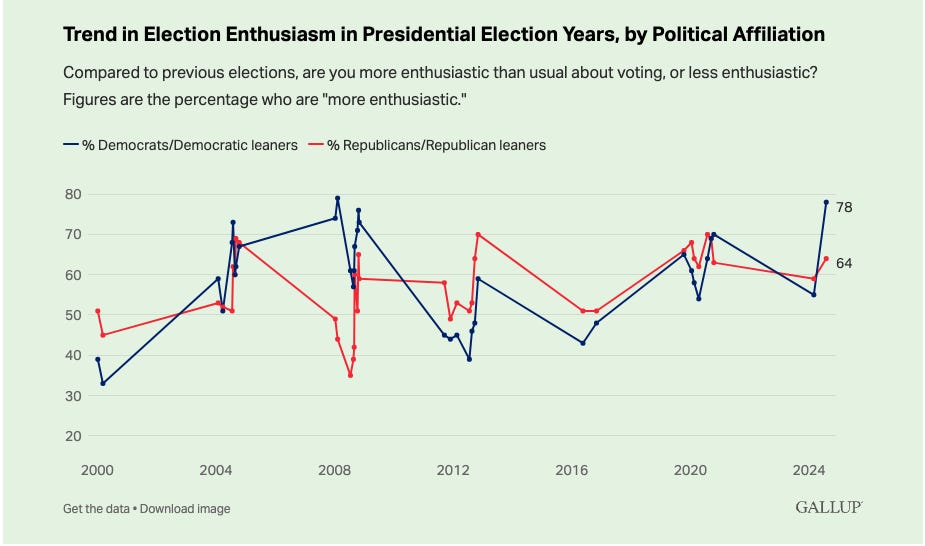
1. Democratic enthusiasm soaring
The swap of Kamala Harris for Joe Biden has sent Democratic excitement about this election through the roof. It’s now at Barack Obama-2008 levels, which is astounding.
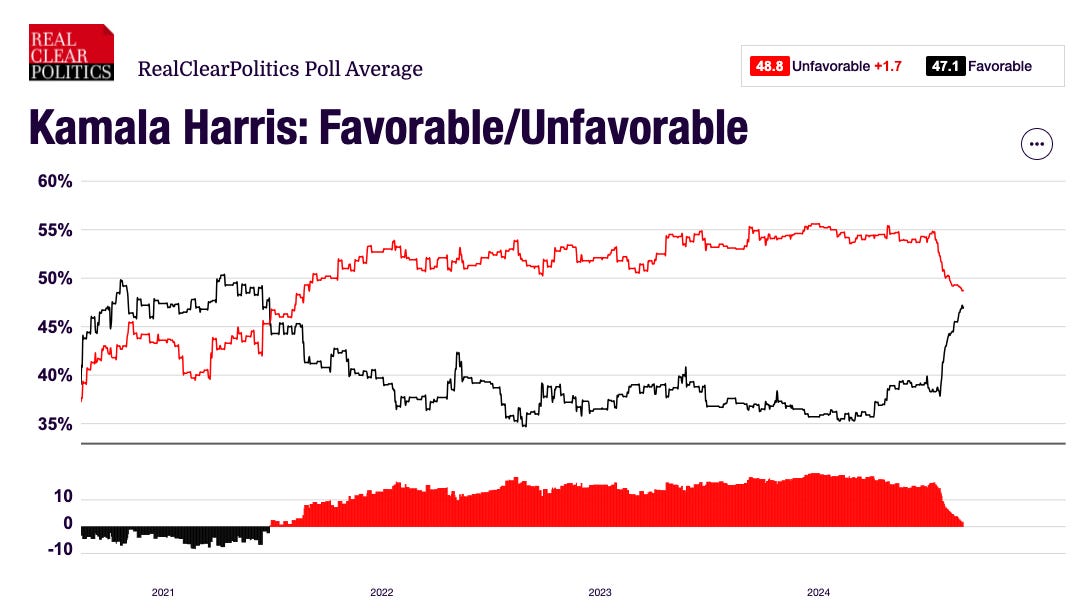
2. The Kamala glow up
I’ve never seen something like this before. Kamala Harris was regarded unfavorably — and consistently so — for almost the entire time she was VP. Then she became the Democratic nominee and, suddenly, people started to like her much more.
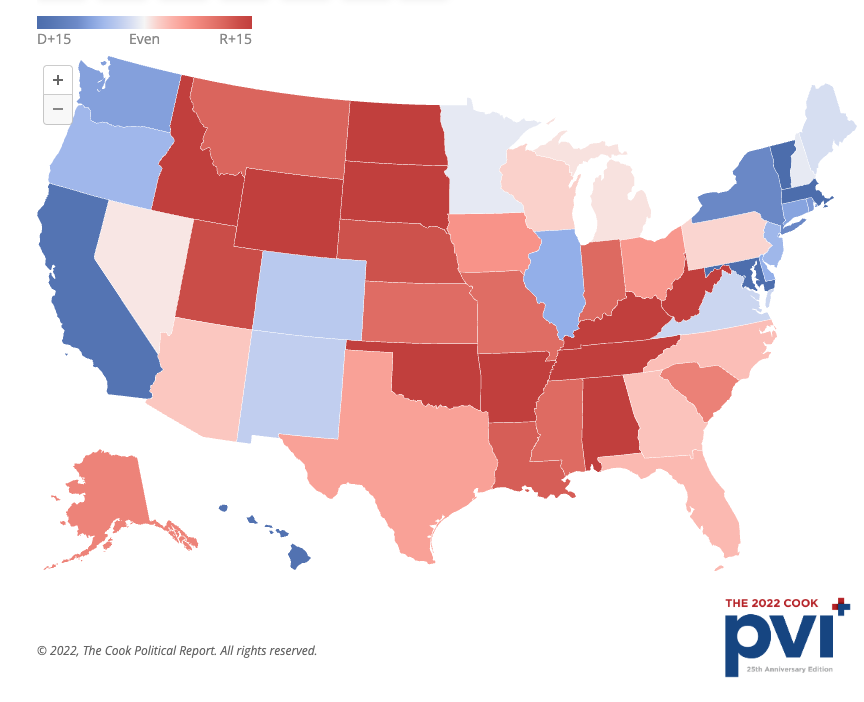
3. The electoral map leans GOP
According to Amy Walter at the Cook Political Report:
In fact, when looking exclusively at the Electoral College map, Republicans are enjoying a stronger advantage than at any point in the 25-year history of the Cook PVI. In 1997, the median Electoral College vote (located in Iowa) had a PVI score of D+1; meaning that the median Electoral College vote was one point more Democratic than the nation as a whole. By 2005, the median Electoral College state (Florida) had a PVI of R+1. In 2021, Wisconsin, with a PVI score of R+2, is the median Electoral College vote. So, if, for example, a Republican presidential candidate were to get 49 percent of the national popular vote, we should expect that Republican to get 51 percent of the vote in Wisconsin.
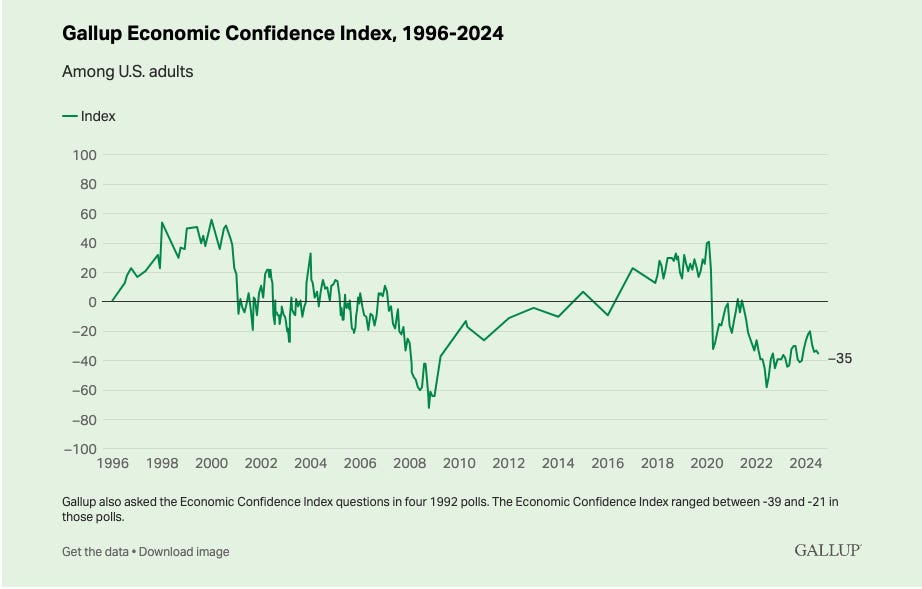
4. Economic Pessimism Reigns
Despite positive news on inflation and job creation — broadly — the average American feels little confidence about where we are or where we are headed economically.
5. Trump is running better than he did in 2016 or 2020
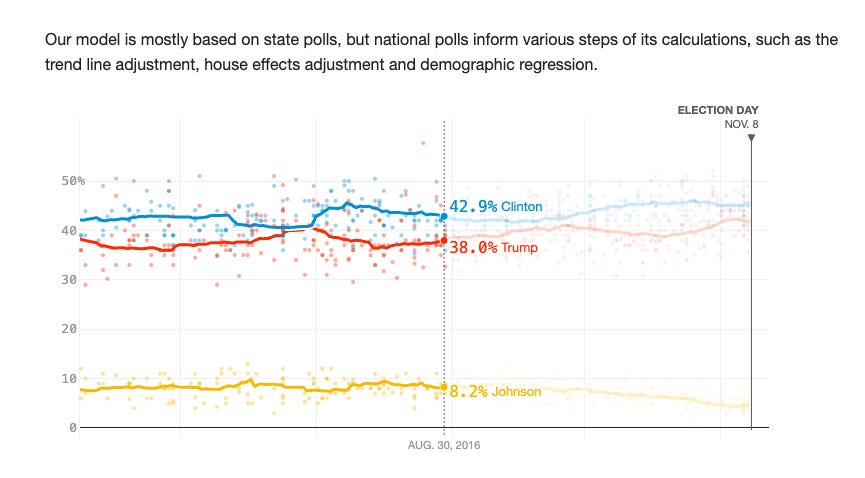
Here’s the 2016 national polling average at the end of August:
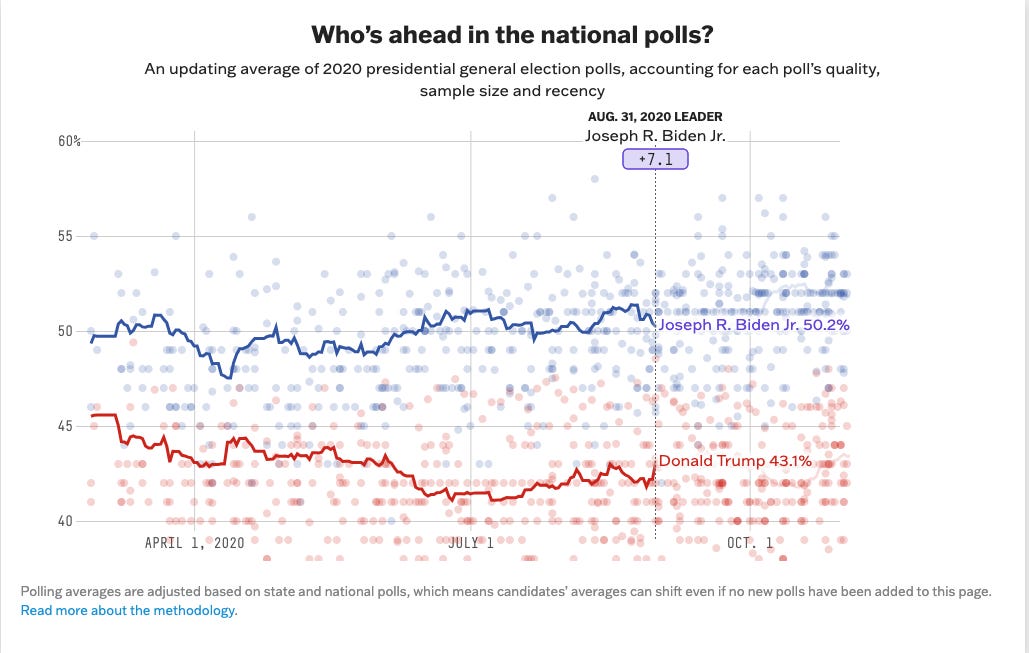
And here it is at this point in 2020:
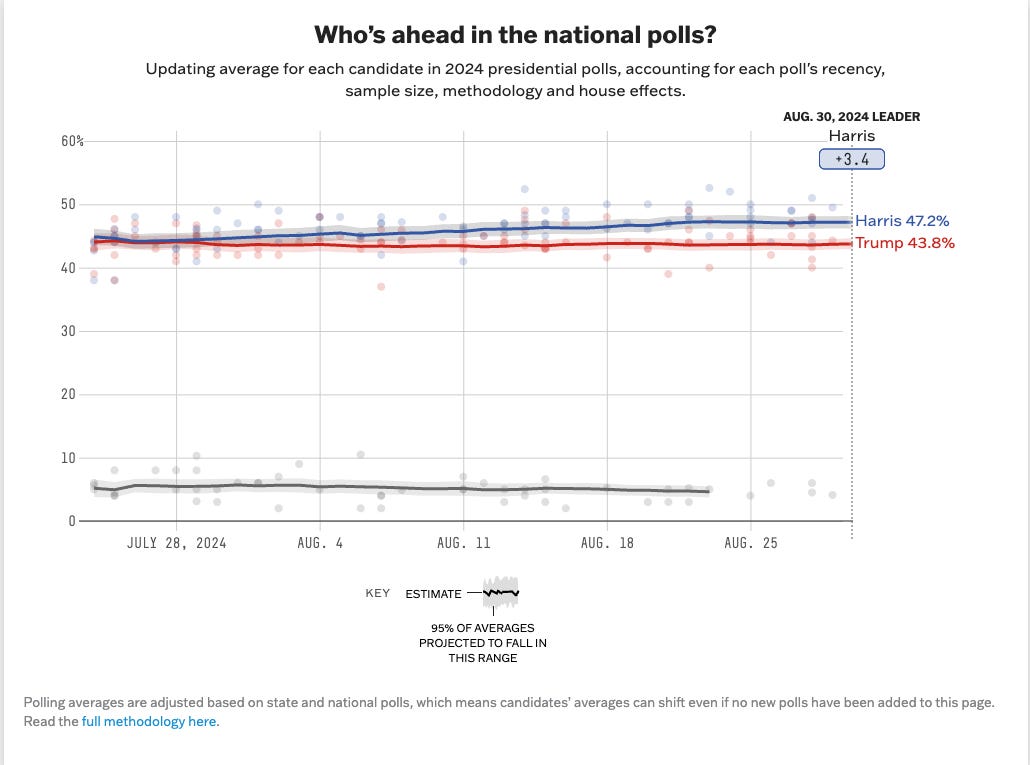
And HERE it is for 2024:
Hillary Clinton was ahead by 4. Joe Biden was ahead by 7. Kamala Harris is ahead by 3. Due to the GOP lean of the electoral college (see chart #3) most independent analysts believe Harris needs to win the popular vote by at least 4 points in order to ensure she wins the electoral college as well.
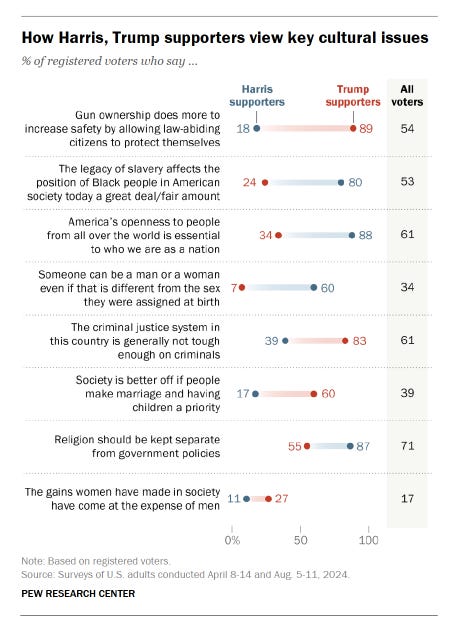
6. Two Americas
People voting for Kamala Harris see society — and American values — in a fundamentally different way than people who are voting for Donald Trump.
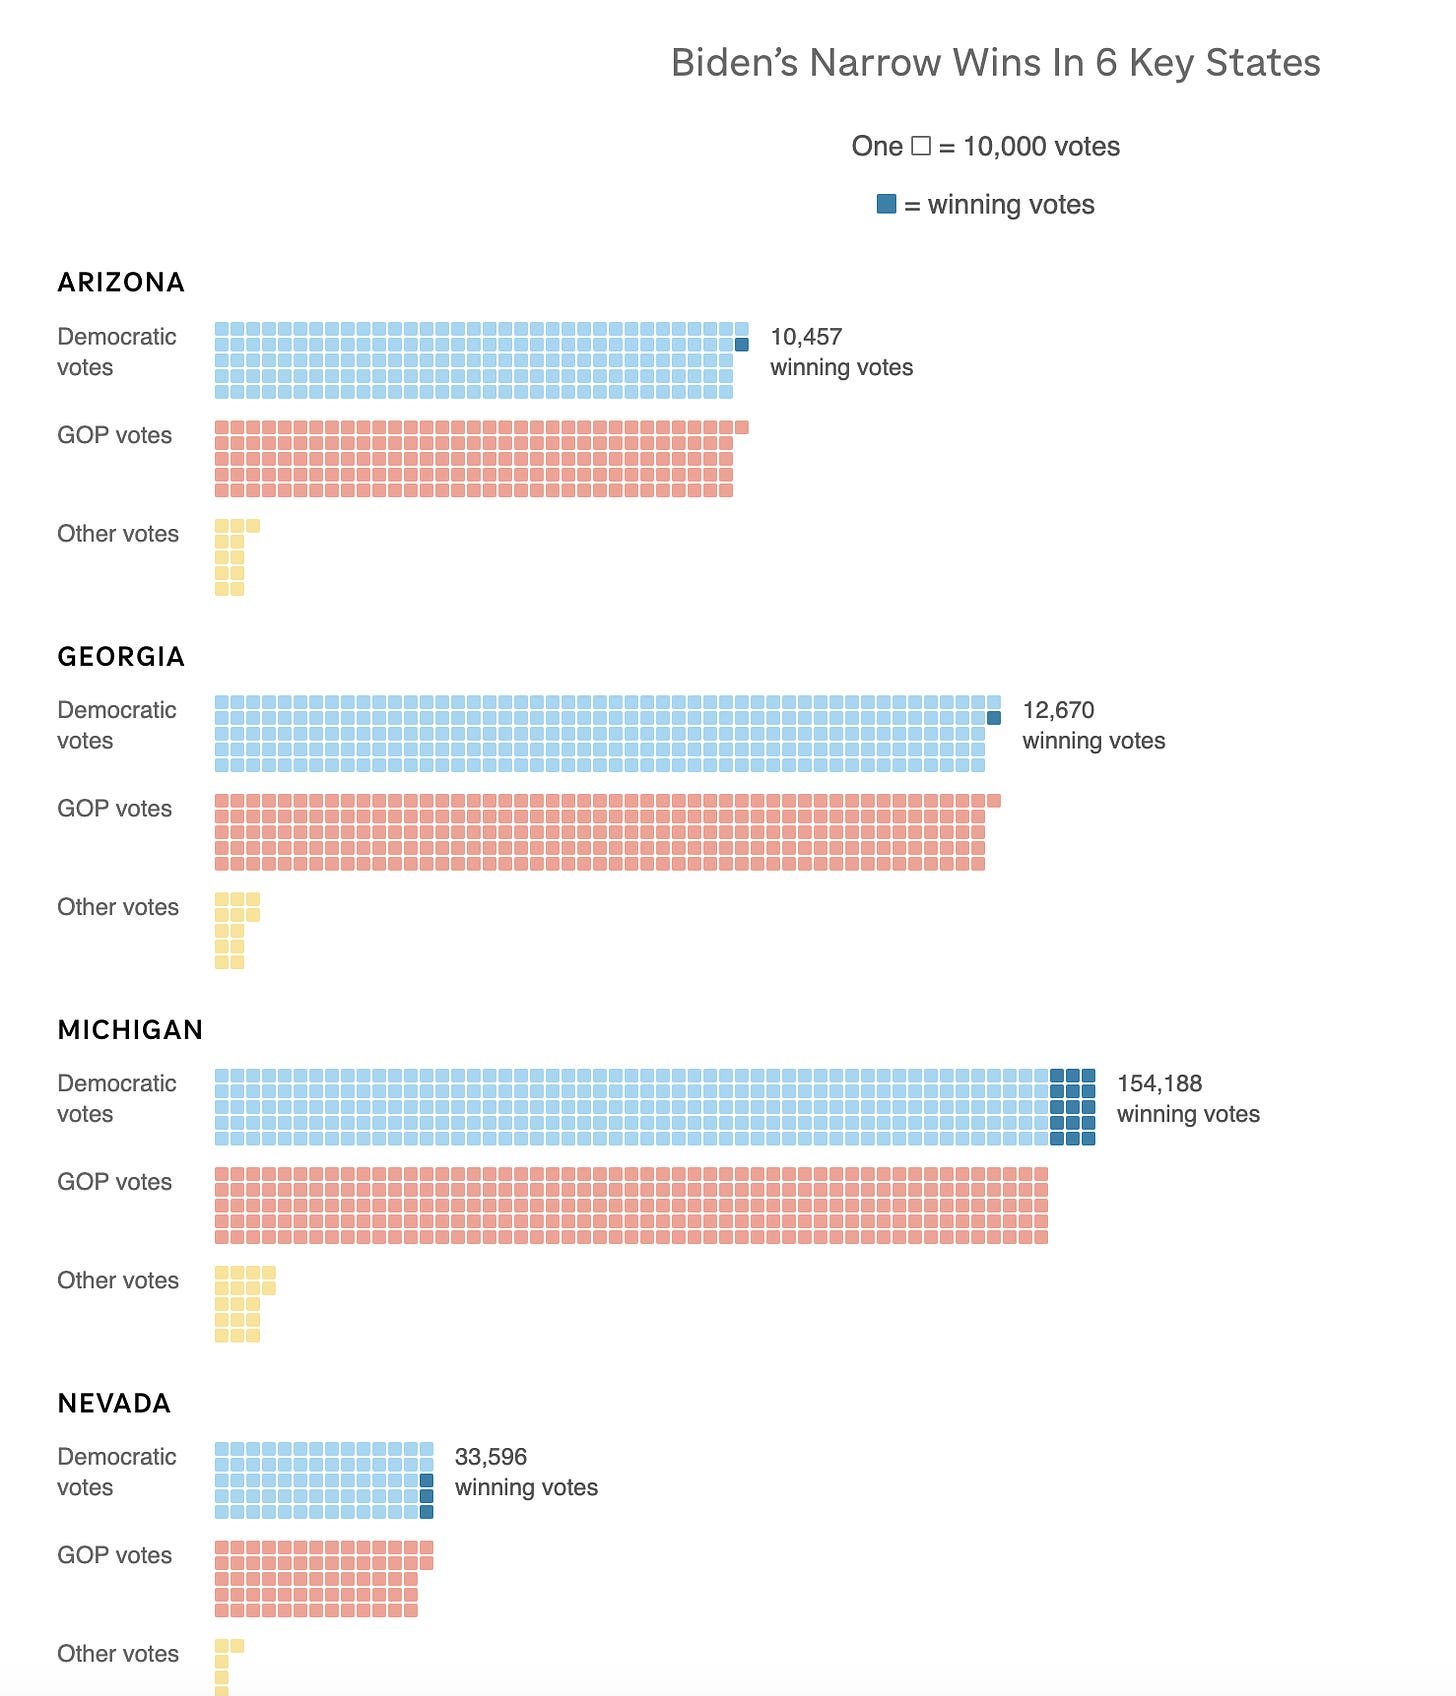
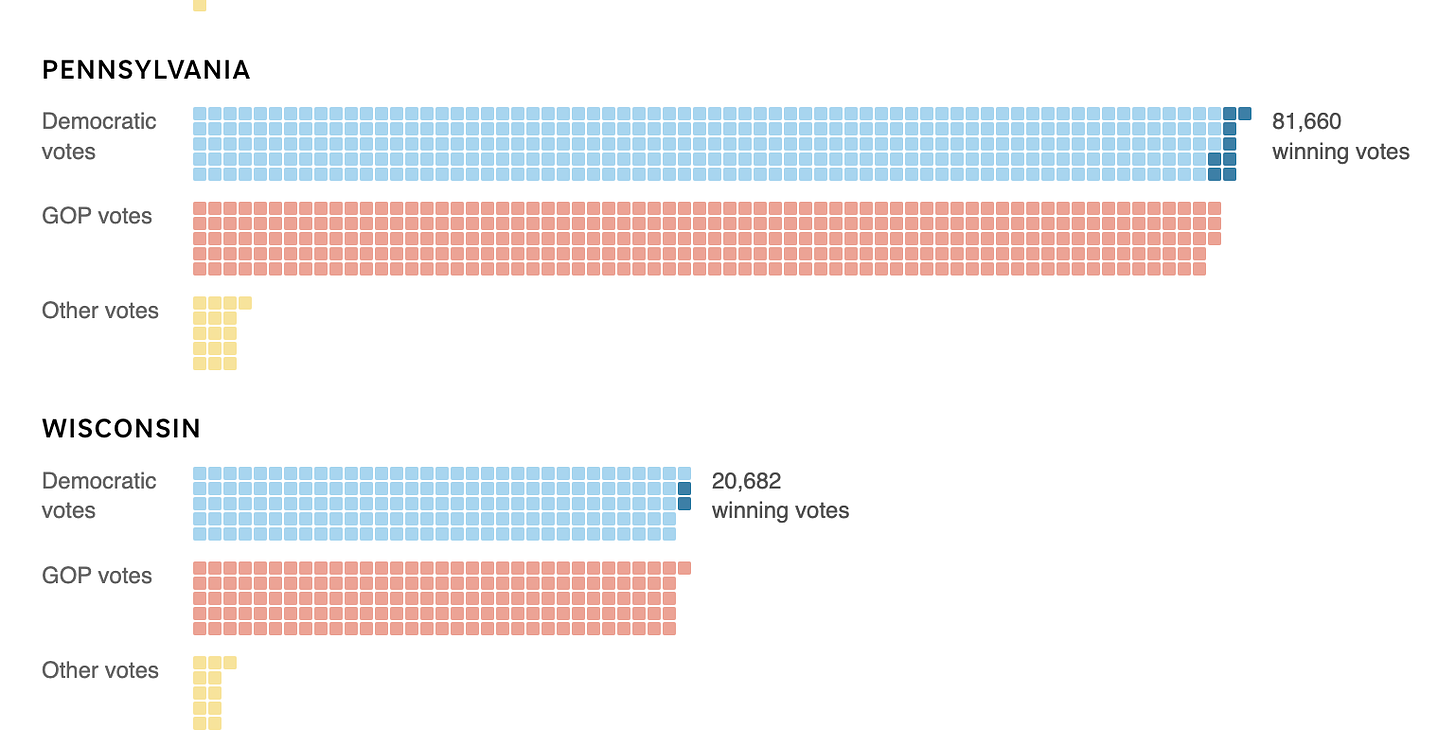
7. This thing is going to be CLOSE
The presidency in 2020 was decided by tens of thousands of voters in 6 swing states. Literally. I think we are headed to something very similar this time around.


Lots of interesting data in this post. Much appreciated. In my view, the most important things are the trend lines. Kamala is on the way up.Yes, she isn't as far ahead as Biden was, but she was starting from a deficit in two respects : 1) Trump was ahead of Biden &2) Kamala was largely unknown. As to the latter point, Sarah Longwell's focus group work is instructive. People didn't have a real sense of Kamala. But now that she is "out there," the focus groups are largely reporting positive reactions. In fact, I think her demonstration of political talent has surprised most of us. I hope and expect her lead to increase.
Women, youngand old, are angry. They may be the wild card in this election!!